The stock market is a funny thing. It is a simple idea – I buy a share in a company so that I enjoy a tiny bit of the profits (or have to undergo part of the loss) – that has had a number of layers placed upon it to both obfuscate its workings (intentionally, in my opinion) and create more opportunities to squeeze out a bit more profit.
This is where you get things like options, puts, calls, and more obscure things such as derivatives (bets on top of bets on top of bets).
Add on to this complexity the pressure of time. The market is now too fast for the average person to compete on a regular basis. Traders have super-computers working at light speed to trade and Ph.D mathematicians working on their strategies.
You can’t compete.
It’s a professional league, and you are a little leaguer at best.
But imagine if the playing field was leveled somewhat and you were given the tools to create a trading strategy and were allowed to release your beast onto the stock market.
Where would you begin? How would you build your trading program?
That’s where this interface comes in. It is a simple method that lets you build a program, piece by piece, until you have something as complex or as simple as you are comfortable with.
Ultimately, you would be able to string together as many elements as possible and then be able to run simulations based on stock market history, allowing you to refine your program and (hopefully) identify the right market conditions in which to switch it on and fund it with real money.
Frequency
How often does your program jump in and find investment opportunities? How often does it cash in? How often does it do anything? Those questions are raised and answered by dragging the clock interface into your program.
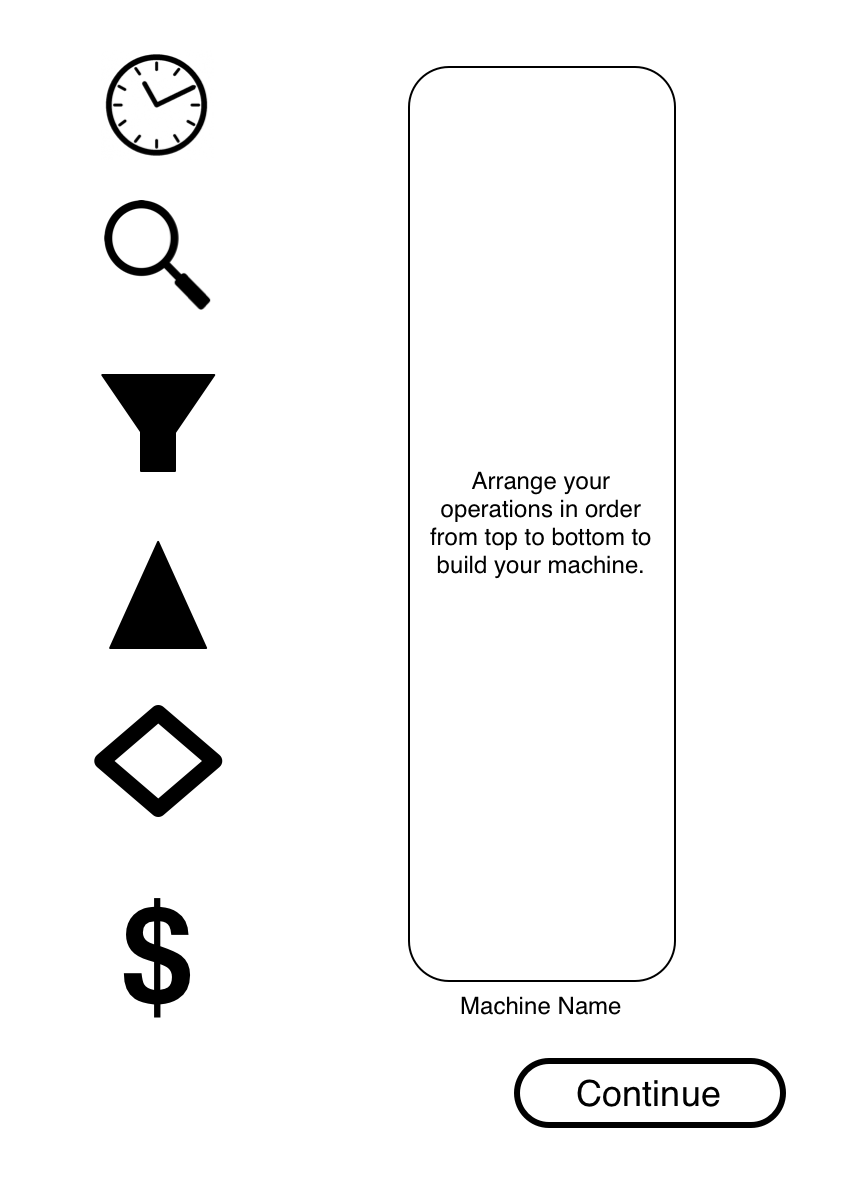
The basic interface. You elements are to the left, your program is to the right. The program will execute from top to bottom.
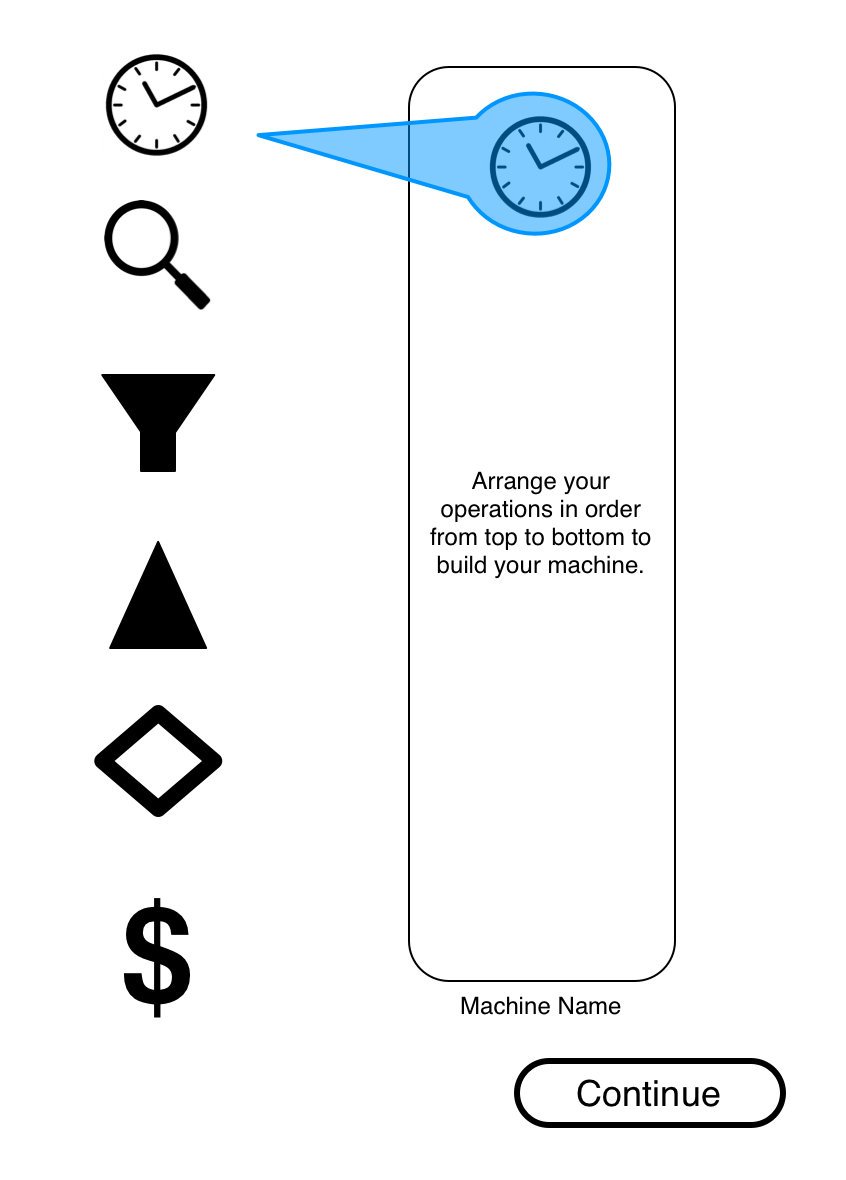
To time your program – determine when it starts up and executes – you drag the clock icon into your program.
On release the scheduling dialog is brought up. In that the user chooses how often the program executes. Options can include {every, every other, every third, etc.} and then the timings can be milliseconds to months, or for the long term investor, the timing can be as long as a year or two.
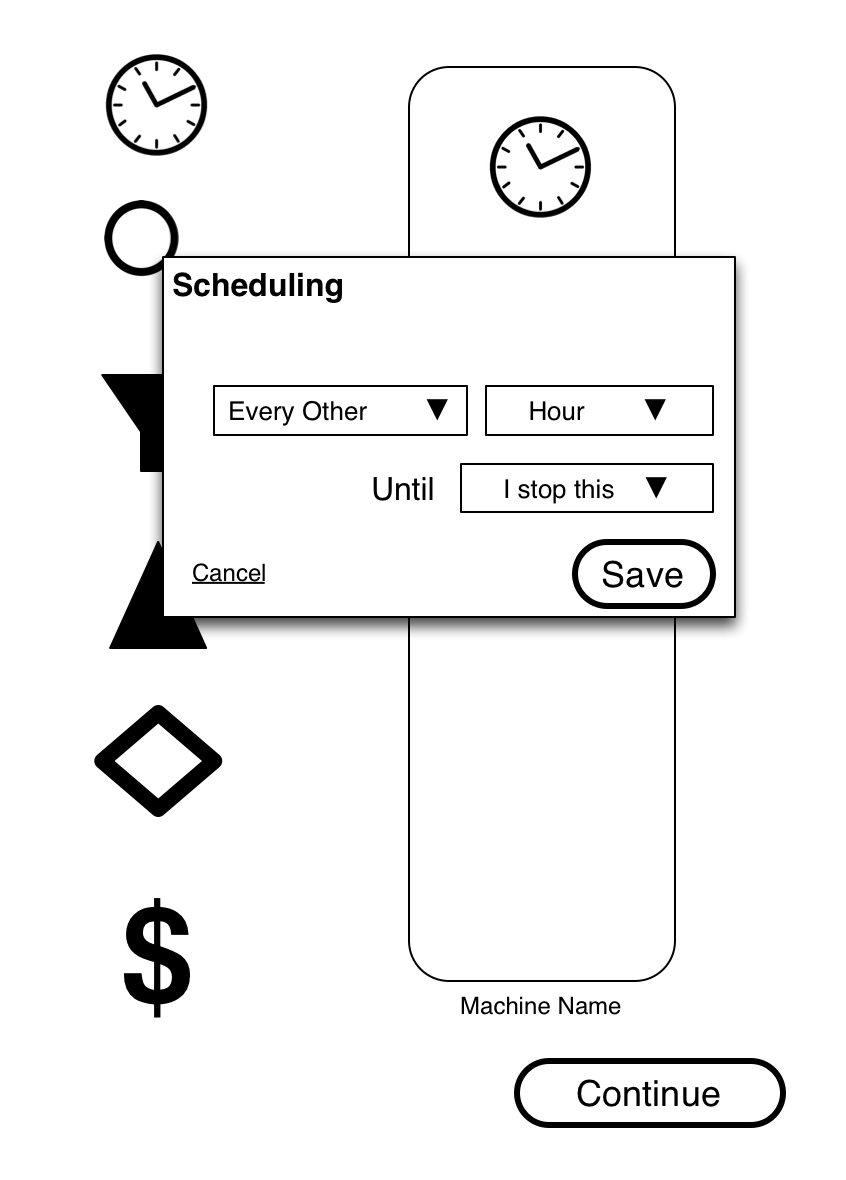
The user chooses a frequency in the form of a sentence with variables represented by drop down menus.
Find
The user then gathers investments to buy/sell. This can be stocks, bonds, ETFs, really any financial instrument that is available to the system.
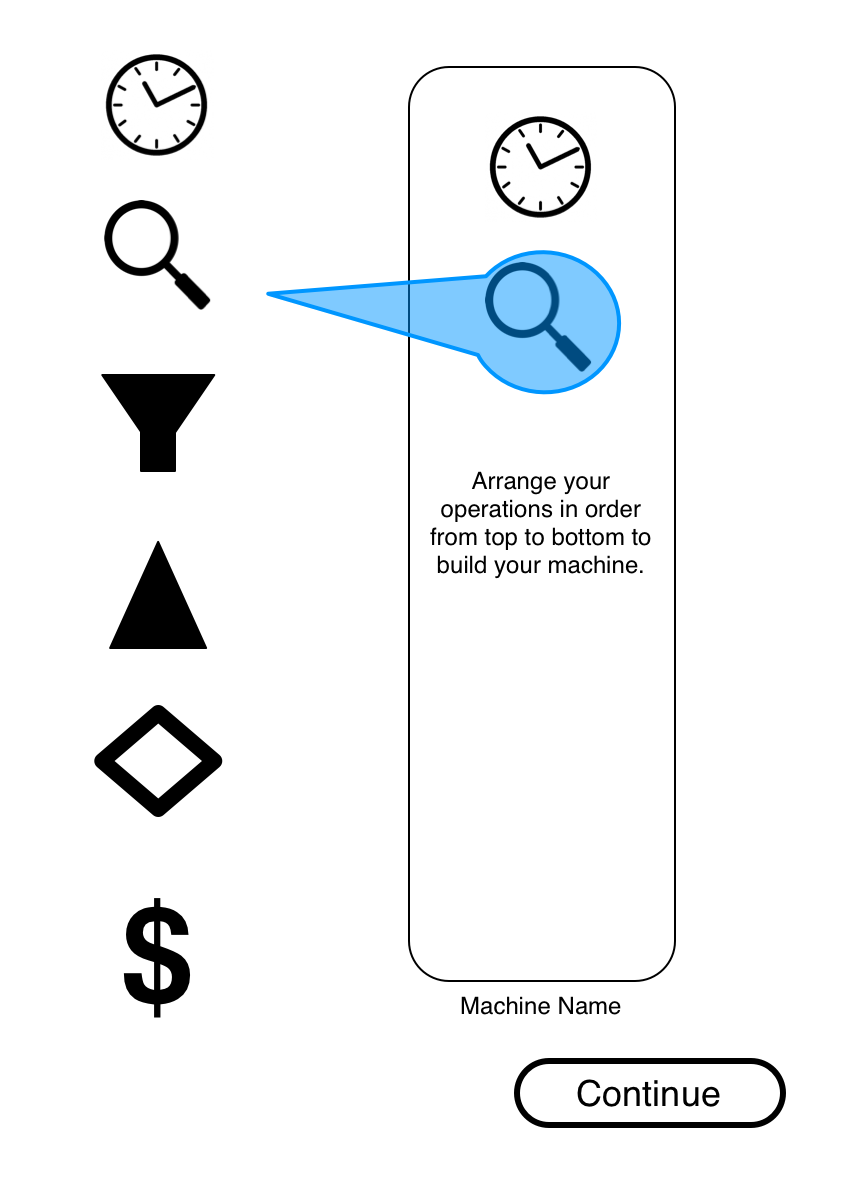
Drag the find icon into the program to gather investment options.

The user then gathers a wide number of possible investments.
At this point the user can drag/drop a buy icon in and buy a LOT of investments. However, the user will most likely want to filter that large set to find the best possible set of investments (no matter what the user’s criteria might be).
Filter (repeat)
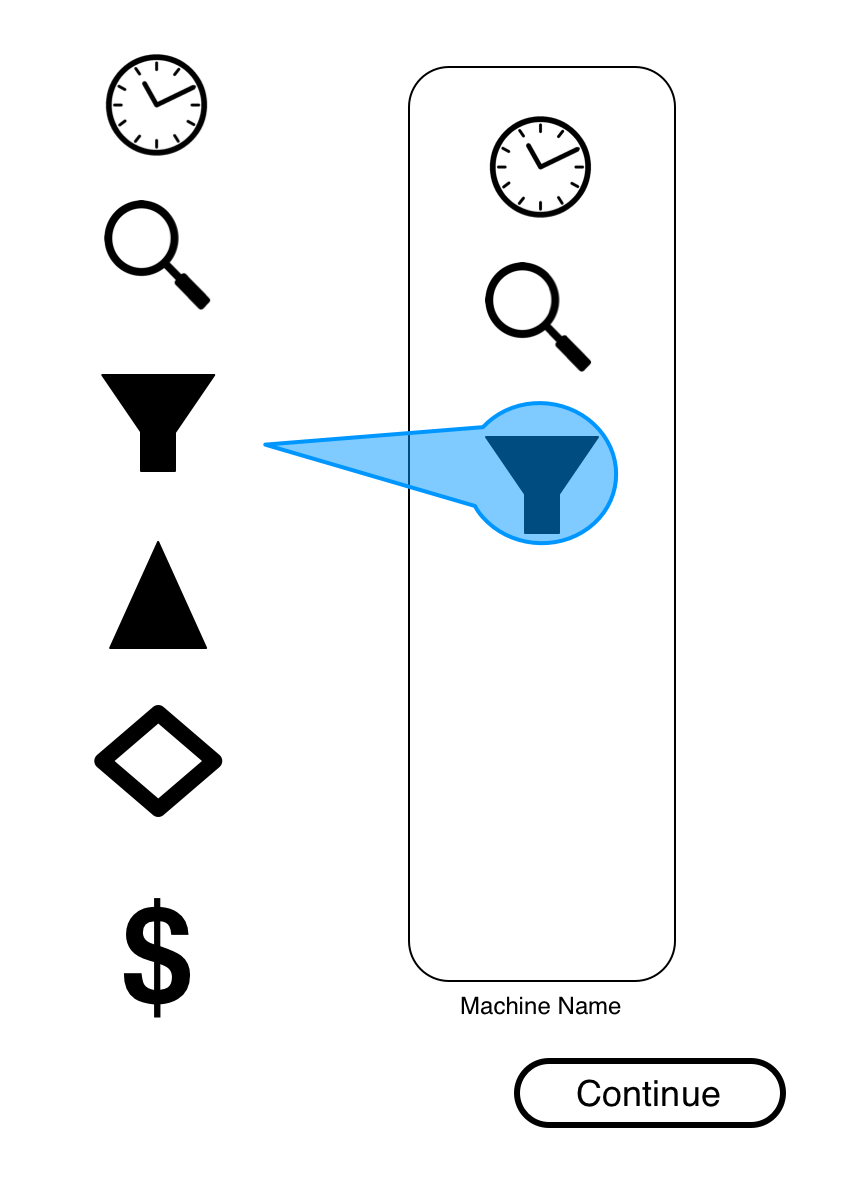
The user then drags in a filter or many filters to find exactly what they want. (Each filter represents a single line of filtration)
The user then defines the filter to be applied. Each filter is limited to one line in this instance (although to make more complex machines, the user will have to have the opportunity to join filters by AND or OR, but for this initial explanation, we’ll keep it simple.)
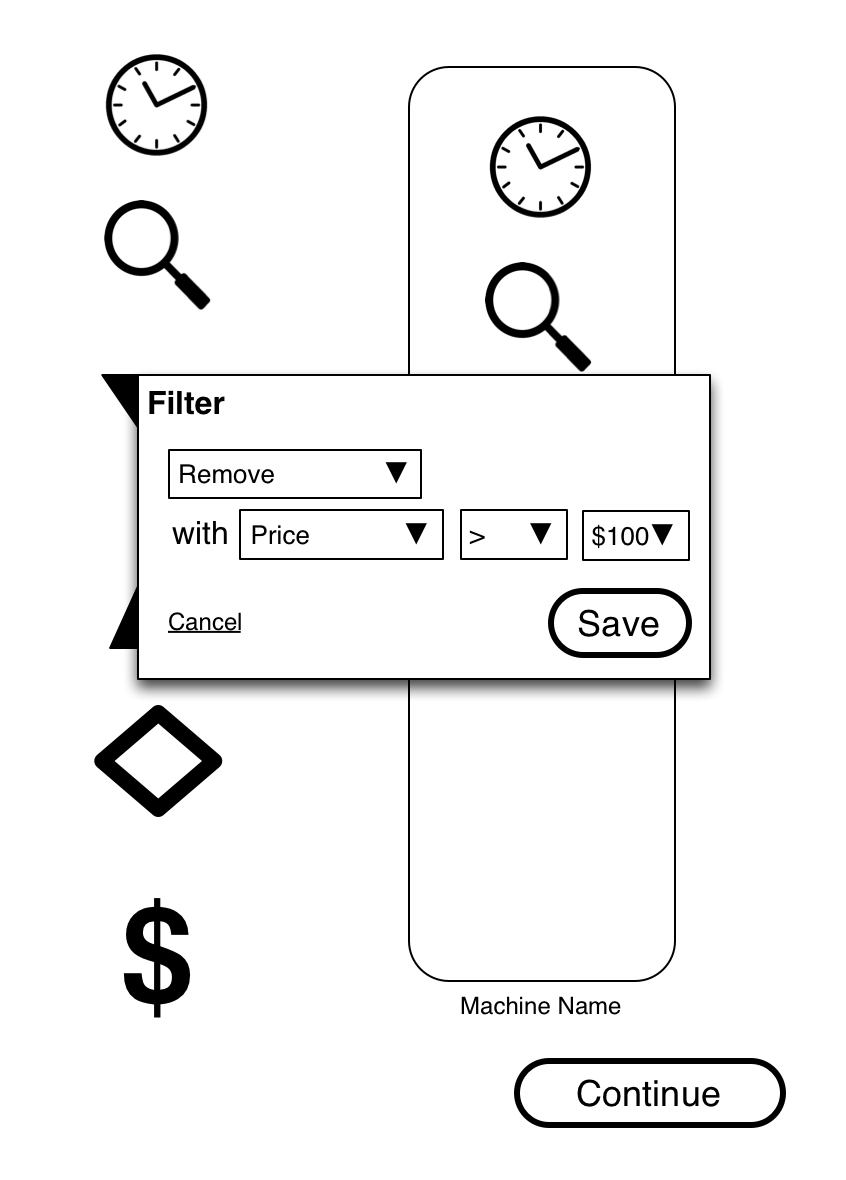
The user then chooses which of the find set to keep or remove. Any statistic of the financial instrument is a possible choice on this filter.
Sort
Then, assuming you have your ideal result set, there is the possibility to sort them prior to purchase/sale in order to determine which of the investments is best (again, determined by the user’s criteria).
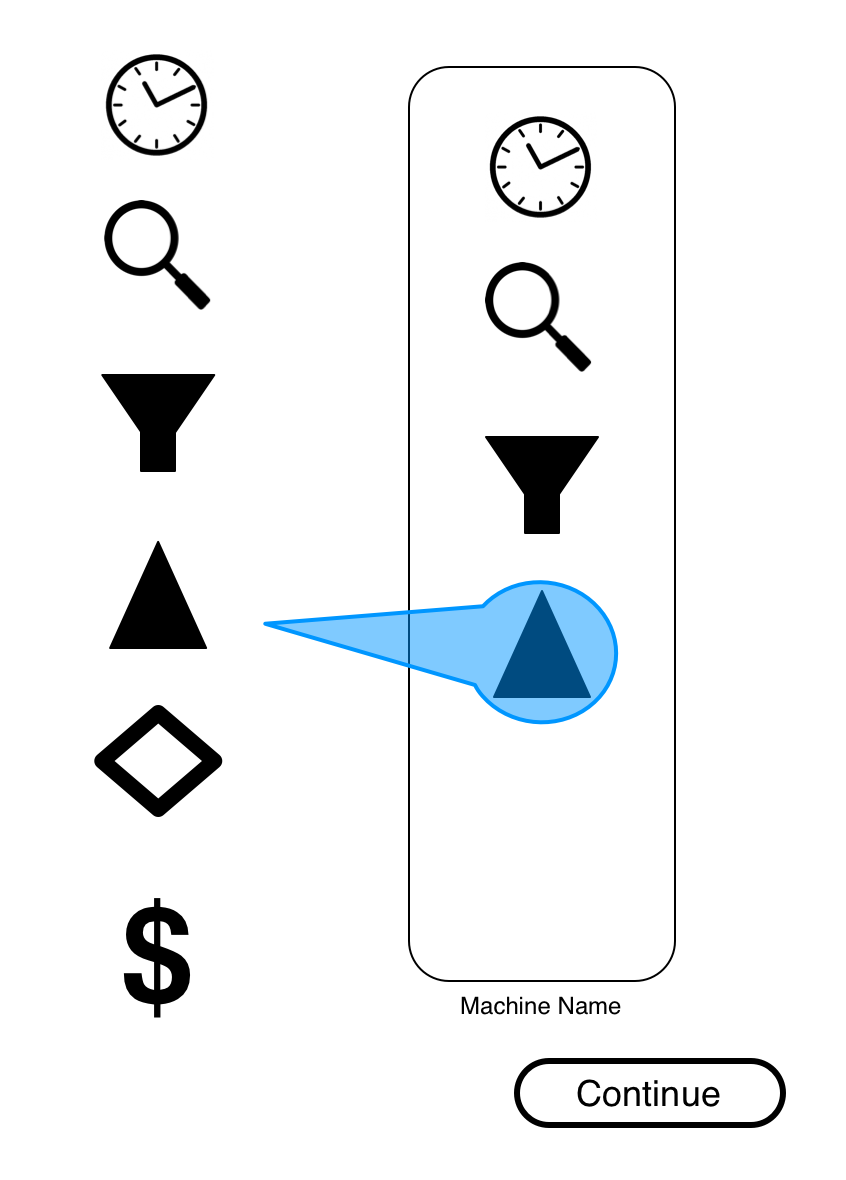
The user sorts the final results.
The sort, unlike the filter, has a multi-line capability. This is intentional as three sorting criteria is enough for nearly every set possible AND because sorting is meant to be a penultimate step prior to purchase or sale.
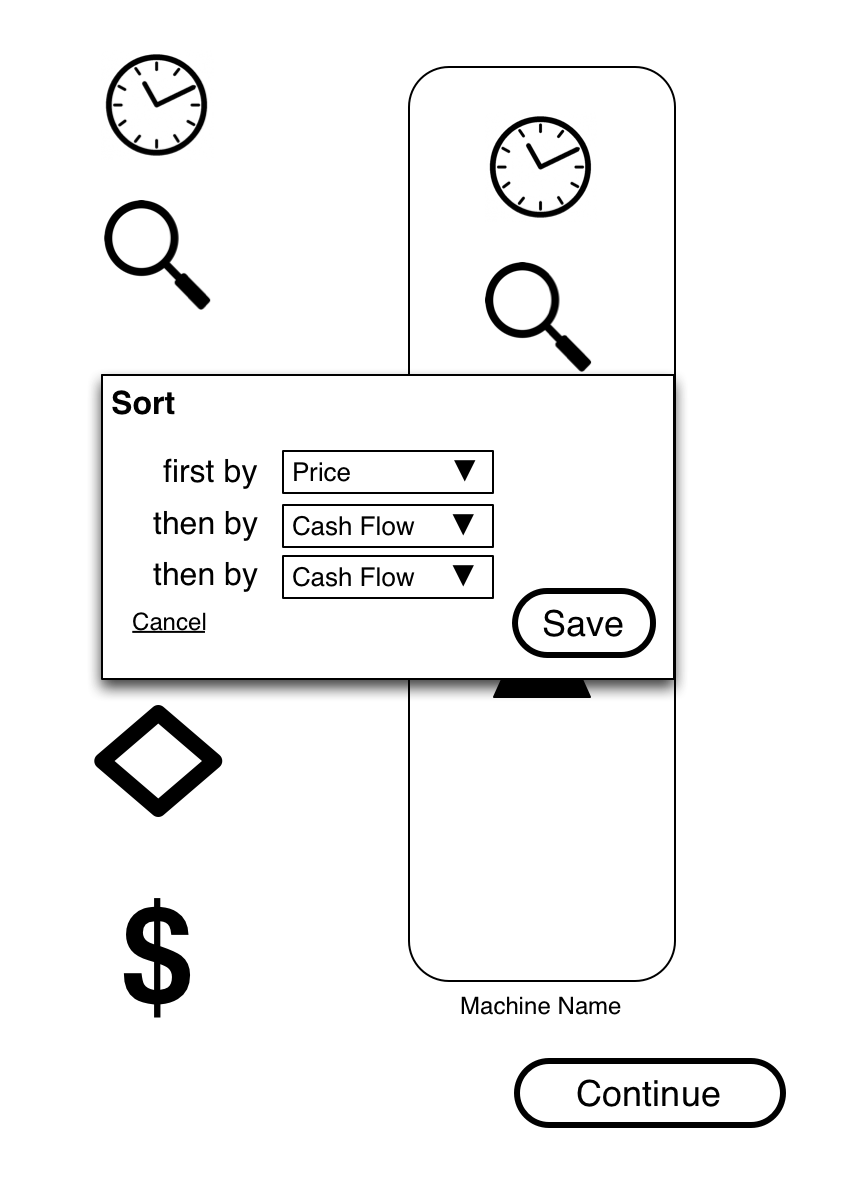
The user gets to choose primary, secondary and tertiary sorting criteria.
Execute
Finally, the money. Whether it is purchase or sale, the ultimate step requires money to change hands. This means the user must choose to buy or sell by share or by amount of money and then to determine how those orders are distributed against the current filtered set. The user can decide to buy the first 5 investments of the found set or to put in $1000 in the first of the set using this dialog box.
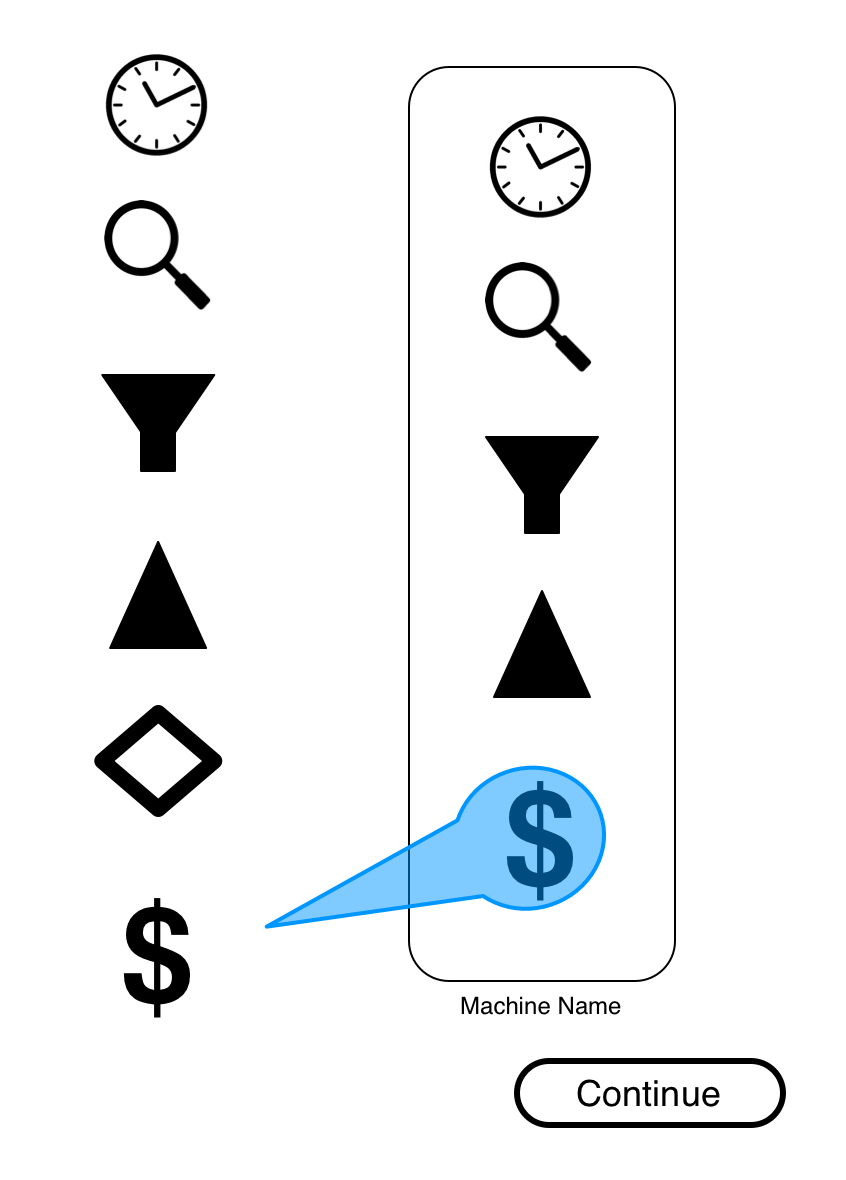
The user drags the ‘buy/sell’ icon to the program.
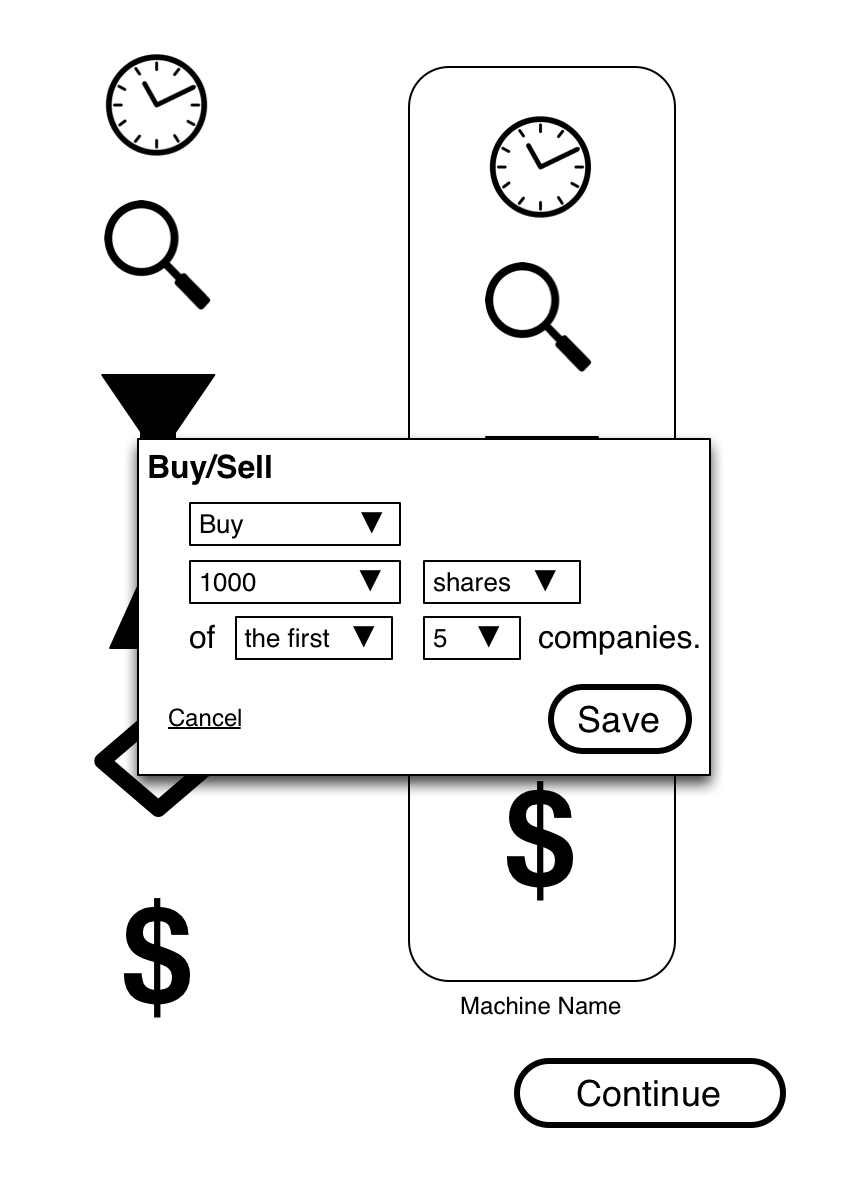
This dialog is a sketch. It will most likely require an additional step to really account for the many possibilities of buying/selling the found investments.
The above example is a very simple program, but it is easy to see that with these simple symbols, it is possible to build a trading program that is complex and flexible enough to enable even the most complex strategy.
Ultimately, this program would then be represented by an icon in a trading floor simulation. The user would decide when to start it (using historical data) and when to end it (again, using historical data). Once it has been tested and verified not to be completely ridiculous (i.e. buying every stock on the market at market prices), the user will have the option of funding the program and letting it loose with real money.
